THIS CONTENT WAS ORIGINALLY PUBLISHED ON MY OLD SITE AND FORMS PART OF THIS SITE’S ARCHIVE
I have held off on writing this, until the last possible moment, primarily because I am not sure how much the local election results tell us. There are a multitudinal amount of reasons why, let me explain.
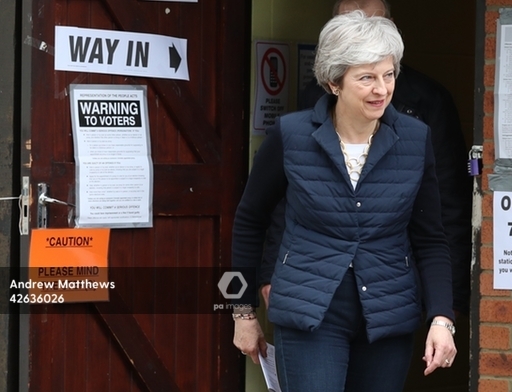
Embed from Getty ImagesONE: LOCAL IS LOCAL, RIGHT?
The first reason is that local elections are primarily about local issues – and local candidates. Whilst many will follow party politics in this, local elections have historically not been the best of indicators of how the public will vote in a general election (especially when a general election may be months or years later).
TWO: TURNOUT
Turnout for local elections is famously lower, usually much lower than for a general election, for example 2019’s election had a turnout accross England of 36.3% of the electorate; whilst the most recent general election (2017) saw an electorate turnout of 69.1% (almost double) and 2015’s “normal” general election saw a turnout of 66% – this is of course just in England.
By contrast to our relatively low turnout during General Elections (compared to other nations) and our even lower turnout for local elections, 2016’s referendum on membership of the European Union saw an unprecedented exercise in democracy, when 73% of England’s registered voters turned out to vote. The last time that high-of-a-percentage of eligable voters voted was in 1992 General Election, which saw John Major victorious.
Aside from the legalities of the 2016 referendum campaign, it was certainly the largest exercise of democracy since the 1992 General Election – though not the highest percentage of turnout for a democratic event – that honour goes to the 2014 Scottish Independece referendum, which saw 84.59% of the electorate in Scotland vote – this is the largest percentage of vote turn-out since the introduction of Universal Suffrage. The higher vote was the 1910 General Election when 84.6% of the fewer men and no women electorate could vote; and the most recent General Election to come even close (since Universal Suffrage) was actually in 1950, when 83.9% of the electorate voted.
The lowest turnout in a general election was recorded in 1918 at 57.2%, due to the end of the First World War. Between 1922 and 1997 turnout remained above 71%. At the 2001 general election the turnout was 59.4%; in 2005 it was 61.4%; in 2010 it was 65.1%; and in 2015 it was 66.1%.
General Election Turnout, Parliament.UK
Low turnout at local elections has been a common theme for decades, back in 2010, Ipsos MORI, the legendary pollster, wrote the following:
Next Thursday will see local government elections being held in most of England, both the high profile contest for London Mayor and the much less heralded contest for more than 3,300 seats on around 150 district and borough councils. Turnout will almost certainly be dire, as it nearly always is these days; last year it was 36% in the shire districts, 31% in the unitary authorities and just 26% in the metropolitan boroughs.
Local Election Turnout, Ipsos MORI, 28th April 2000.
And again, as this BBC article from 2013 highlights, local elections “…are not always a reliable indicator of what will happen at a general election.” As Labour in 2003 (Local) and then 2005 (General), the Conservatives in 1990 (Local) and then 1992 (General), – both are examples of electoral drubbings for the parties in the local followed by massive wins at the General. Sometimes the opposite is also true, Labour had bad results at the 2009 Local, followed by a disasterous General Election result in 2010; and the Conservatives have their own 2010 General in 1997, following their very disasterous result in 1995. Essentially, we can’t use Local to predict very accurately the results of the next General Election – sometimes they show a feeling, sometimes not
What then do Friday’s results show?
The results of Friday’s Local Election results in England make interesting reading. Comparisons with the previous local election results is not helpful, though most news sources seem to be using them, the Press Association (and also the Guardian) favoured the numbers at the dissolution of each local government authority (i.e. councils) as they represented the most accurate figure for comparison – e.g. where Councils were reconfigured, such as the Bournemouth, Poole and Christchurch Council mergers, to create a Unitary Local Government Authority on April 1st 2019. This means that those large headline figures change.
Take the headline figure of 1330 Councillor losses for the Conservative party – that’s the figure the BBC put out, the Guardian’s figure is 1269. For Labour the result is less drastic, they lost 84 councillors according to the BBC, the Guardian reports a loss of 63.
And the result is more important when discussing the number of Controls of Councils (i.e. number of Councils) gained or lost. The Conservatives, according the BBC lost 44 councils; 46 Councils according to the Guardian; and Labour, lost 6 councils by the BBC’s count, whilst they lost 7 councils according to the Guardain’s numbers. Essentially it looks like the Conservatives started with 4828 Councillors and ended with 3559 Councillors whilst Labour started with 2083 Councillors and are now on 2020 Councillors (Guardian Figures).
Or did the Conservatives start with 4894 and are now down to 3564; and Labour started with 2105 and fall to 2021 (BBC Figures)?
To differencitate between the two main parties results, is actually quite important – because the losses are not as close as some outlets would have you believe – take the losses for each party at the previous local elections…
At the 2015 Local Elections the Conservative Party gained 541 Councillors taking their total to 5521 Councillors (from 4980 Councillors); whilst Labour lost 203 of their 2481 Councillors (down to 2278 Councillors) – to look at those percentages is important (2015 being the most recent Council Election of similar scale (in terms of number of Local Authorities).
Embed from Getty Images2015 saw Labour’s Councillor percentage fall by 8.18% and the Conservatives number of Councillors rise by 10.86%; whilst 2019’s result saw Labour decrease by 3.02% and the Conservatives fall by 26.28% (based on Guardian figures for both) or the Conservatives fall was 27.18% whilst Labour’s fall was 3.99% (according to the BBC’s figures).
With regards to the Council’s lost – the Number of Conservatives Councils is down by 32.12% (based on BBC figures) their increase in 2015 was 24.43%. Labour however lost 9.09 % (BBC); compared to 2015 when they lost 3.9 % (they lost 3 Councils in 2015).
The Labour Party’s loss in 2019 is within the margin of error for an opinion poll with regards to Councillor’s lost (to be fair their loss of Councils is technically just outside a margin of error for most opinion polls). The Conservative’s can’t spin this as anything but a disaster, electorally.

Lets talk now about the Liberal Democrats rise.
For Number of Councillors they gained 676 Councillors, bringing their total to 1351 from 675 Councillors, that’s more than double, or 100.15% increase (based on Guardian Figures). The BBC says they gained 704 Councillors, taking the total from 647 to 1351, a 108.18% increase.
Their Council gains are statistically no less impressive, they gained control of 10 Councils according to the BBC, taking them from 8 to 18 Councils, or a 125% increase.
Embed from Getty ImagesThe Greens gained 185 Councillors (Guardian) or 194 (BBC); meaning they rose from 80 to 265 (Guardian) or from 71 Councillors to 265 (BBC) – the increase is either 231.25% (Guardian) or 273.24% (BBC) – they gained control of no councils, but nor did they loose any.

The final headline result is the UKIP result. These are a little more confusing for me as the numbers are so different. According to the BBC, UKIP lost 145 Councilors, according to the Guardian they lost 36. This means they started on either 145 Councillors (BBC) or 67 (Guardian) and ended up in both cases with just 31 Councillors. In this case their fall was either 78.62% or 53.73%. Either way they lost this local election more than the Conservatives.

So is it about Brexit?
To argue if the local election results are related to Brexit, is an attractive idea for remainers (less so for Brexiteers and their lesser highly-missguided cousins, Lexiteers). But honestly, we just can’t, not intellectually – whilst UKIP a very Anti-EU party lost heavily, that could be more because of their lurch beyond the Centre-Far Right, to the Far-Far Right recently; and the introduction of their former leader’s new party – The Brexit Party, which did not stand a single candidate at the local elections. Then there is the fact that people voted to punish the two main parties (we don’t know how many, but it seems a significant amount) – also remember that the numbers of spoiled ballots, which had “Deliver Brexit” spralled all over them seems to have been significant (though I haven’t seen a figure, and can’t find one, as we only record spoiled ballots and not what they say).
Also these are seen by many people, unfortunately, as fairly insignificant elections – hence low turnout; also it is likely that many who do vote also see them in this way – and so its a “safe” occassion to vote against the two major parties – General Elections are when many “hold their noses” and vote for “the lesser of two evils”.
Embed from Getty ImagesWhilst it seems likely that a significant proportion of voters now support remaining in the EU, over-and-above leaving the EU – how many of these support a second referendum or even the Liberal Democrates and Greens is difficult to argue. The % fall for Labour is fairly insignificant from a statistical perspective – the Conservatives do not have that luxury.
What the Local Elections can say about Brexit
What the local elections can (I am confident) say about Brexit is that those who voted in England do not want the current options presented by the Conservative Party – either Theresa May; her deal; or their in-fighting. Labour can be a little more reserved here – they are under continuing pressure to back a side – and whilst I might agree with that position – I do think their statistically right not to throw their hands up too early – they recieved a slight decrease, but loss of councillors compared with those in 2015 was significantly statistically less; loss of councils was still only single figures.
The Liberal Democrats and Greens are right to continue their particular arguments here; but they may find that many who voted Lib Dem or Green don’t do so at the EU elections later this month. And with the new Brexit Party and even Change UK – or the Indepdent Group, however poor these groups are or are not polling at the moment, the EU elections will probably show some interesting results.
Embed from Getty ImagesDepending when the next General Election is, will depend on how well these results transfer through – and frankly its anybody’s guess who will win that one.